
Part I · Fundamentals · Chapter 15
Publishing online
Exporting turns a chart into a file. Publishing gives it an address: a page of its own, at a link you can send to anyone or embed in any web page, where the chart stays live — tooltips, interactive filters, zoom and animation included. It is free, and the one thing it asks of you is an account.
What gets published
A published chart is one chart tab: its settings, and the data it needs to draw — every row, but only the columns the chart actually uses. It goes online at gphcdn.net, under an address of its own, and from then on:
- Anyone with the link can see it, embed it on their own pages and download its data with Get the data. Graphica does not list published charts anywhere and asks search engines not to index their pages, but it does not keep them secret either: treat everything you publish as public.
- Your project stays where it was. Publishing uploads a copy of that one chart, not the project, and the project goes on living in your browser, as described in Your workspace.
- You can change your mind. Republish to replace the chart with a new version at the same address, hide it, or delete it.
Signing in
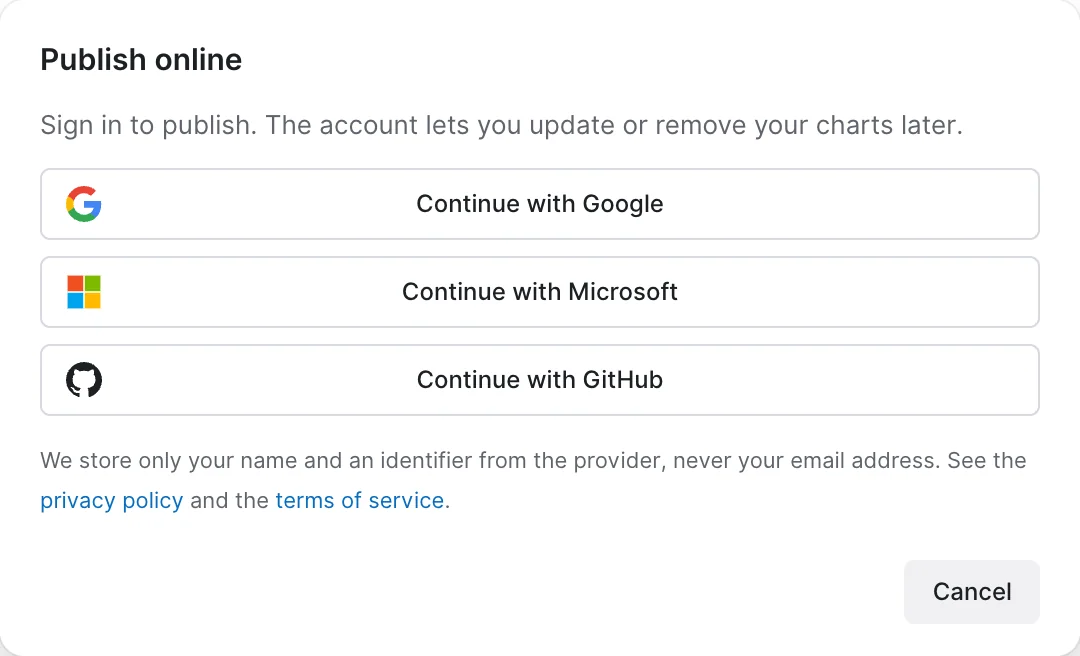
The first time you publish, Graphica asks you to sign in with an account you already have: Continue with Google, Continue with Microsoft or Continue with GitHub. The sign-in opens in a small window of its own. Graphica keeps your name and an identifier from the provider, never your email address, and the account exists only so that you can update, hide or delete your charts later.
Once you are signed in, your initials appear at the right of the toolbar. They open a menu with My published charts… and Sign out. A session ends on its own after two hours without use, and after twelve hours in any case, so a shared computer does not stay signed in for long; signing out yourself is still the safe habit there.
Publishing a chart
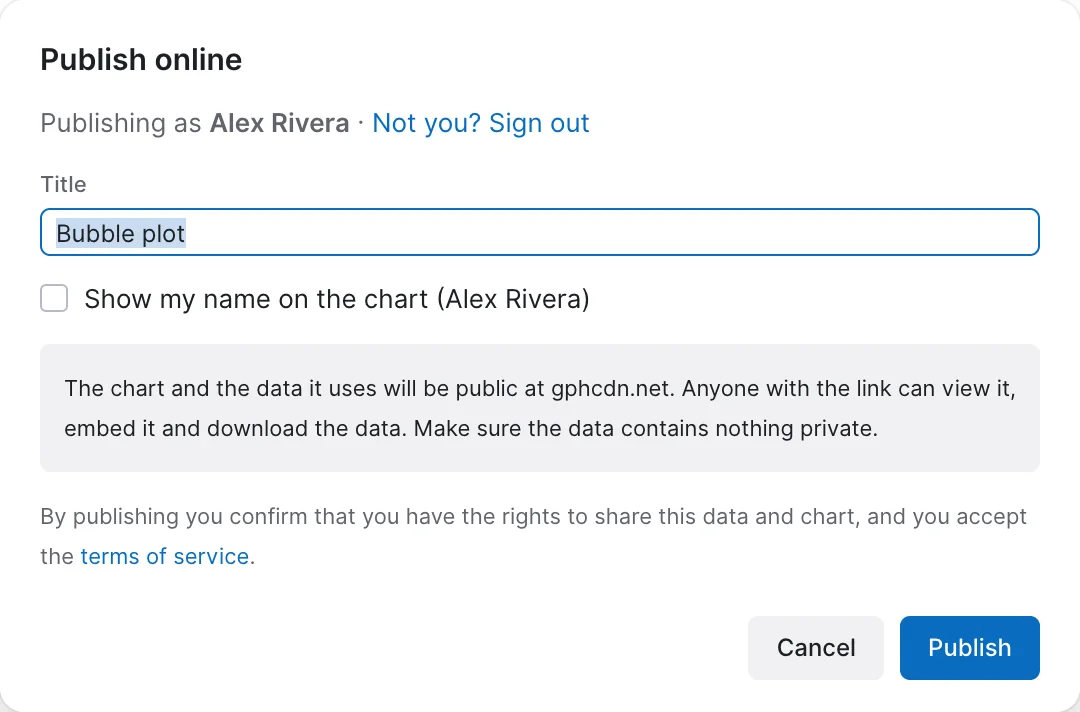
With a chart tab open, press Publish, at the right of the toolbar. The dialog asks for little:
- Title — the name of the published chart, on its page and in your list. It starts as the chart's own title, or the project name if the chart has none.
- Show my name on the chart — writes your name in the footer of the published chart. Off by default.
Below them, the dialog states what is about to become public, and warns you when there is something to check: which columns stay behind, when the chart does not use them all; columns whose names suggest personal data — an email, a phone number, a name — since the whole column goes online; and fonts other than Inter, which readers who do not have them installed will see replaced. Publishing also has limits: a dataset of up to 3 MB, 100,000 rows and 200 columns, and chart settings of up to 1 MB, which only custom shapes and embedded images tend to reach. A chart over a limit cannot be published, and the dialog says which limit and by how much.
If the publishing service cannot be reached, the dialog says so instead of waiting, and offers to try again. Nothing is lost: the project stays in your browser, and the chart can be published later. The same notice appears in My published charts and when a published chart is opened in the app.
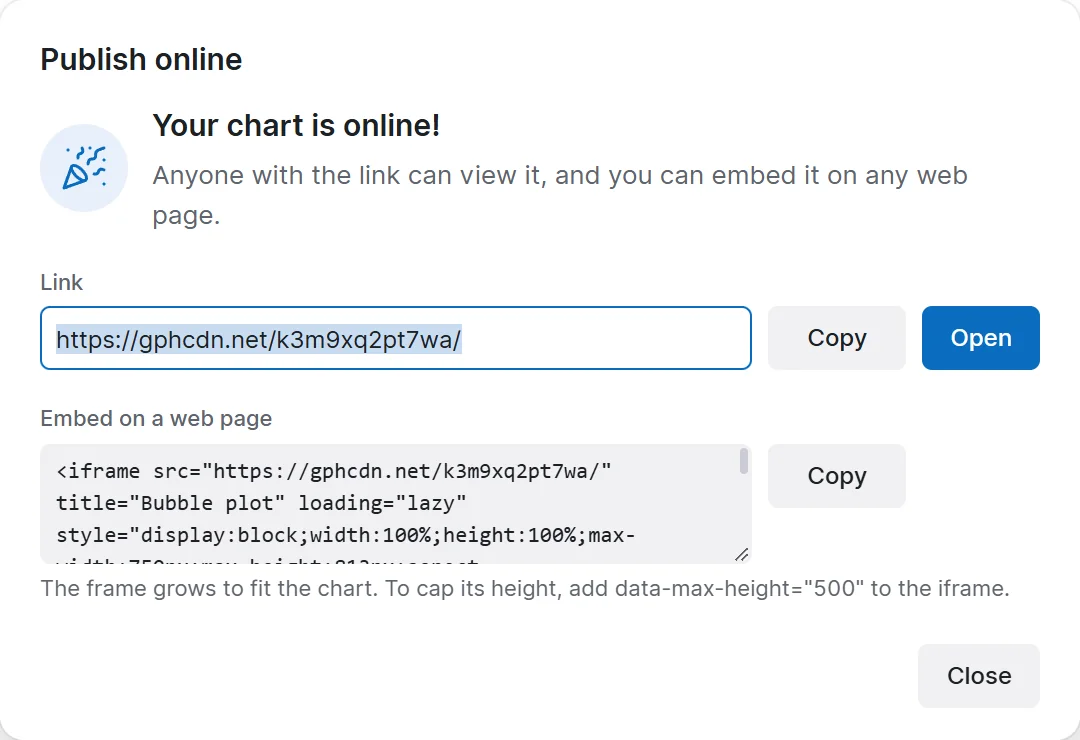
Press Publish and, a moment later, the dialog gives you the result: the link, with Copy and Open, and the code to embed the chart in a web page.
The Publish button
The button in the toolbar always shows the state of the chart tab you are on, and its tab carries a small cloud once the chart is published:
| The button reads | Meaning |
|---|---|
| Publish | The chart has not been published. Pressing it opens the dialog above. |
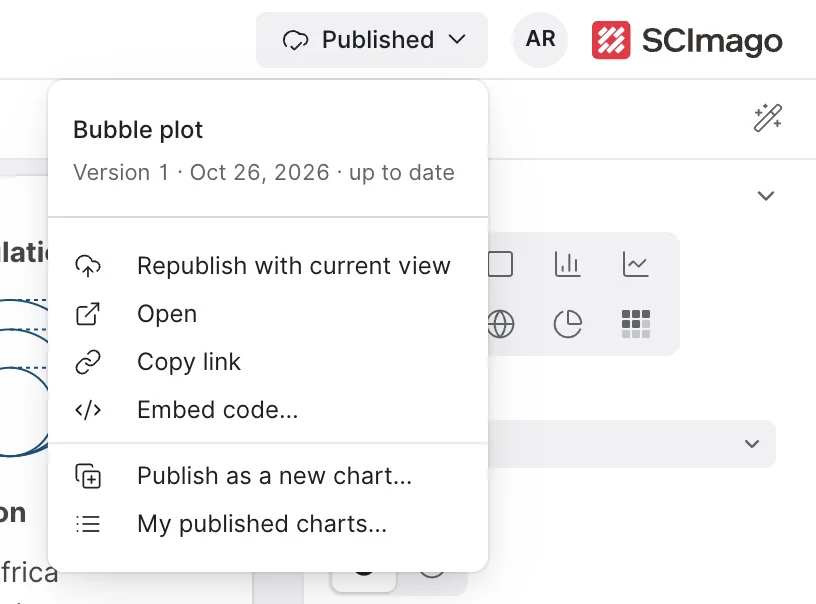
| Published | The published version matches the chart as it is now. Pressing it opens the menu below. |
| Republish | You have changed the chart since you published it. Pressing it publishes the changes; the arrow beside it opens the menu. |
| Hidden | The chart is published but hidden, so its link shows nothing. |
| Removed | The chart was taken down for breaking the terms of service. The notice you were shown explains why. |
Updating a published chart
Republish, or Republish with current view in the menu, replaces the published chart with the chart as it is now — settings and data — at the same address. The version number goes up, and everyone who opens the link, or a page where it is embedded, sees the new version. Nothing has to be sent or embedded again. Earlier versions do not stay online: if you published a column by mistake, republishing without it takes its data offline, though anyone who downloaded it before keeps their copy.
When you want a second chart rather than a new version of the first — a variant for another audience, a snapshot to keep — use Publish as a new chart…: it publishes the chart tab at a link of its own and leaves the first one as it was.
The tie between a chart tab and its published chart travels with the project. Download the project as a .gph, open it on another computer, sign in with the same account, and the tab still knows which chart it publishes.
My published charts
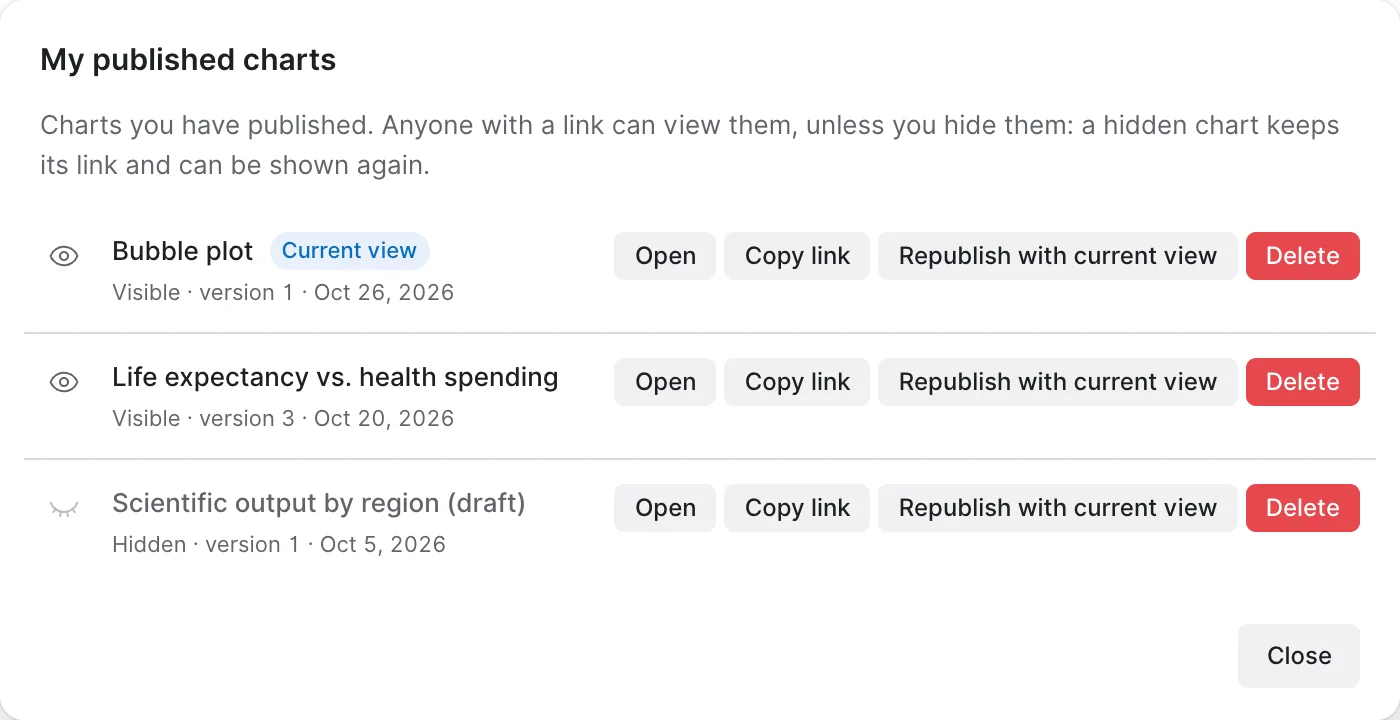
My published charts… — in the Publish menu, in the account menu and in the sidebar of the workspace — lists every chart you have published, with its state, version and date. Each row offers:
- The eye, to hide the chart or show it again. A hidden chart keeps its link and its data, but the link shows nothing until you show it again.
- Open and Copy link.
- Republish with current view, when a chart tab is open: it replaces that published chart with the tab on screen, and ties them together from then on. It is also the way to point an old published chart at a chart you have since rebuilt.
- Delete, which takes the chart and its data offline for good, after asking. If you might want it back, hide it instead.
Hiding and deleting may ask you to sign in again, to confirm that it is really you. An account can keep a limited number of published charts; deleting the ones you no longer need frees their place.
Embedding
The embed code is an iframe: paste it into any page, blog or site builder that accepts HTML and the chart appears there, interactive and current. It takes the published width and height, which are the Width and Height of the chart under Page setup, and scales down to fit narrower columns. Setting the size before publishing is as worthwhile as it is before exporting.
The embed code also includes a small script that lets the chart tell the page how tall it needs to be, so that it never gets cut off: a bar chart with many categories, a Gantt chart or a set of small multiples simply takes the height it needs, and the frame on the page follows. Very tall charts, such as a ranking of hundreds of bars, stop growing at twice the published height and scroll inside the frame instead, with the footer always in view. To cap the height yourself, add data-max-height="500" to the iframe tag, or place it in a box with a fixed height and overflow: hidden: the chart then scrolls inside that height, footer in view. If your site builder strips scripts, the chart keeps the published proportion instead, filling whatever box the page gives it. On a phone the chart is laid out again for the narrow screen rather than shrunk down, so it stays readable: the data area keeps the proportion it had when you published, and titles, axes and legends take the room they need.
Under the chart, embedded or not, runs a footer: Made with Scimago Graphica, your name if you chose to show it, Get the data to download it as CSV, Open in Graphica, and a button that opens the chart filling the window. On a narrow chart the two links fold into a menu.
What readers see
Opened directly, the link shows the chart on a page of its own, with Share this chart for the link and the embed code, and a Report this chart link at the foot of the page, for content that breaks the terms of service.
Open in Graphica lets a reader take the chart further. It opens the app in their own browser and, after asking, loads the chart and its data as a new project of theirs, which they can change as they please. Your published chart is not affected: they are working on a copy.
Everything in Adding interaction works on the published page, and an animated chart plays there with its own controls — see Animating a chart.
Before you publish
- Is everything in the data fit to be public? Only the columns the chart uses go online, but all of their rows do. Filtering a row out of the chart does not keep it out of the published data.
- Have you set the size? It is the size the chart is embedded at.
- Does the chart name its source? The footer is the place, as for an export.
- Is the title the one you want readers to see? It is on the page, in the browser tab and in the embed.
That is Part I
You can load data, correct its types, build a chart by encoding variables onto visual properties, control how rows are grouped and combined, restrict what is drawn, label it, make it interactive, and get it out of the app — as a file or as a live chart with its own link. That is the whole working cycle, and most charts never need more than this.
Part II takes seven specialized jobs and covers each end to end — maps, networks, clustering, trend lines, distributions, part-to-whole charts and animation. They can be read in any order, and each assumes only what you have read so far.