
Part II · Advanced topics · Chapter 7
Animating a chart
Animation shows a chart one step at a time — one year, one month, one stage — and moves the marks from each step to the next. It is a channel like the others: drop a date or a category on Animation and the chart gains a play button. Fifty years of countries drifting up and to the right say something a static chart struggles to say. It is also easy to overuse, so the chapter ends with when not to.
Adding an animation
Drag a variable onto Animation, the property just before Filters. It takes one variable, a date or a categorical one. Each of its values becomes a step, and the chart draws the rows of one step at a time. A number is marked invalid, with This visual property can only be used with categorical variables. If it really is a year or a stage, change its type, or clone it and type the copy — see Data types.
Nothing else changes. The axes, the colors, the labels and every other setting describe each step, and the marks keep their identity from one step to the next, so they travel rather than blink. A chart with Animation is the same chart, drawn once per value.
The controls sit under the chart, above the footer, and they are the ones in Figure 1. The round button plays and pauses. The slider has one dot per step (a long series gets a plain track); click it or drag its handle to go to any step, which also pauses playback. The step on screen is written large and pale in the background of the plot, behind the marks. The controls appear as soon as there are two steps or more.
While it plays, the chart does not respond to the pointer: no highlighting, tooltips, filtering or zoom, so nothing gets in the way of the motion. Click or tap anywhere on the chart to pause it, and everything works again.
The steps
What counts as a step depends on the variable:
- A date steps by its aggregation, chosen under Steps in the variable's settings. Auto picks a grain to suit the range of the data; Year, Quarter, Month or Day (and Hour, Minute or Second, when the column carries a time) move forward through time. The cyclic grains — Month of the year and the like — fold it instead: the step "March" gathers every March in the data, which is how to animate a season. Steps run in chronological order. The grains work exactly as they do elsewhere; see Aggregating dates.
- A categorical variable steps through its values in the order set under Sort: the order in which they appear in the data, alphabetical, by another variable, or one you set by hand — the natural choice for stages, phases or versions.
Filters run first, so the steps are the values that survive them. A filter on the same date is how you animate a period rather than the whole series: Figure 1 filters Year to 1975–2023, because the data has no health spending after 2023, and before 1975 South Korea spent less than the $100 at which its axis starts. Each step is named the way a legend would name it — a date with the format of its aggregation, a category by its alias.
Settings
The Animation group of the variable's settings decides how the steps are played. Click the variable on Animation to get there; Steps, above it, is the aggregation of a date.
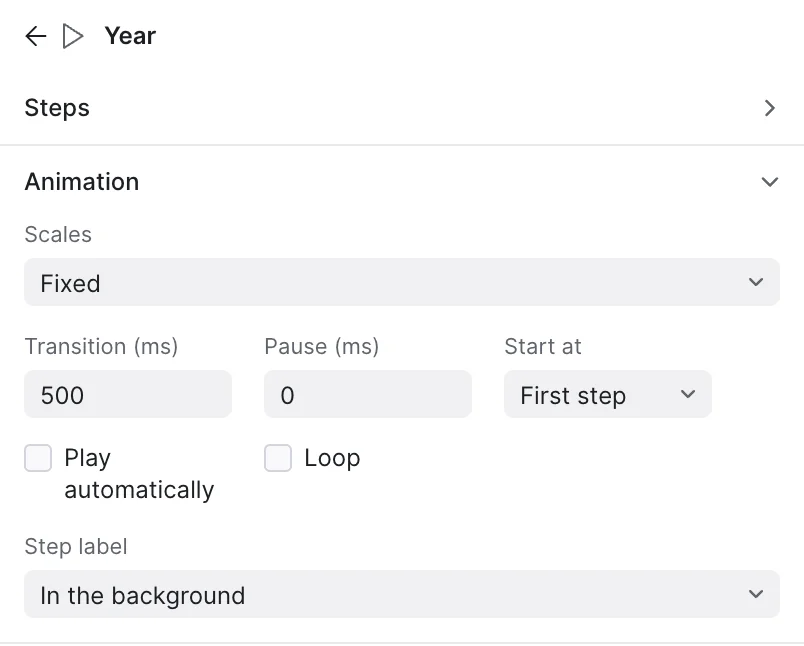
| Setting | What it does |
|---|---|
| Scales | Fixed, the default, or Change at each step. The next section is about this choice. |
| Transition (ms) | How long the marks take to travel from one step to the next: 500 milliseconds by default, up to 5,000. At 0, each step replaces the last at once. |
| Pause (ms) | How long each step holds still while playing. At 0, the default, the steps follow each other without stopping, as one continuous motion. A pause of a second or two gives the reader time to read each step. |
| Start at | First step or Last step: the step shown when the chart is first drawn. Starting at the last step shows the latest state and lets the reader play back to it. |
| Play automatically | Starts playing as soon as the chart is drawn — except for readers whose system asks for reduced motion, for whom it waits until they press play. |
| Loop | After the last step, starts again from the first and keeps going. Without it, playback stops at the last step, and pressing play there starts again from the beginning. |
| Step label | Where the name of the step on screen is written: In the background of the plot (the default), Next to the slider, or Both. |
Fixed or changing scales
This is the decision that matters most, because the two settings answer different questions. Figure 3 has the same chart under each one: play both and compare.
- Fixed measures every step before drawing any of them. Numeric and date axes span the whole series, the size and color scales cover every value, and the categories on an axis or in a legend are those of all the steps, in one order. A mark moves only because its own values change, so the reader can compare 1990 with 2020 by position, as on a static chart. It is the right choice for reading change: who grew, how much, how fast.
- Change at each step scales each step to its own data. The numeric axis stretches and shrinks as the animation plays, and categories sorted by value re-sort at every step, so bars climb past each other — the "bar chart race". The reader follows the ranking within each step; magnitudes can no longer be compared across steps, because the ruler changes under them.
In both, a category keeps its color from step to step. Limits you set yourself on an axis still hold: Figure 1 starts its spending axis at $100 rather than at a bare decade of empty space.
Fixed scales
Change at each step
How marks travel
Animation only reads as motion if each mark in one step is recognized as the same mark in the next. Graphica works that out by itself, and it helps to know how:
- Marks that stand for groups — bars, lines, slices, rectangles, or any mark with a variable on Unit — are defined by the categorical variables of the chart. The Animation variable is not one of them: it never splits a mark, the way a variable on Filters never does. The bar for Western Europe in 2010 is the bar for Western Europe in 2011, at a new length. The same holds when the Animation variable also sits on Label or Tooltip, to write the year on each mark.
- Marks that stand for rows — points with nothing on Unit — are a different row in every step: Spain in 1990 and Spain in 1991. Graphica looks for a column that names them, the first categorical column whose values never repeat within a step: the country, in a table of countries by year (Entity, in Figure 1). If your data has none, or Graphica picks the wrong one, put the column that names your marks on Unit.
- A mark missing from a step fades out, and fades back in when it reappears. Graphica does not invent values for the steps in between. In Figure 1, France blinks through the years it has no data for, in the 1970s and 1980s, and Italy and Israel fade in when their series start, in 1988 and 1995.
- Labels travel with their marks, and a label whose only change is its number counts from the old value to the new one: the bar labels of Figure 3 tick up as the bars grow.
- Marks that split or merge — the bins of a histogram recomputed for each step, say — open out of, or close into, the marks that share their rows.
Settings tied to a single mark follow it through the steps. Pin the label of one country, give it a color of its own or annotate it, and the label, the color and the note stay with that country in every step — the simplest way to give an animation a protagonist. The exception is a chart that also uses the Animation variable on an axis or on Color: there each step's mark is a different one, and a setting made in one step stays in that step.
Charts that grow
When the Animation variable also sits on an axis, each step shows its own rows and all the earlier ones. The chart draws itself as the animation plays, from the first step to the one on screen: lines stretch, bars by year join the axis one after another, points with the date on the X axis fill it in. Lines and areas do the same when their points are connected by the Animation variable — the date on the X axis that is also on Animation, as in Figure 4, or the connection variable of a connected scatter plot, where each mark leaves its path behind it.
With Change at each step, the date axis runs instead from the first date to the one on screen, exactly: the lines always reach its right edge, and the earlier years close up to make room for each new one.
The exception is a date that goes round a different cycle on the axis than in the steps — month of the year on the X axis and years on Animation, say. There the axis is not the sequence of the steps: each step shows that year's months, and the line moves from one year's profile to the next instead of growing.
The same variable can sit on Animation and on any other property, not only on the X axis of a line; Graphica neither warns about it nor prevents it.
Maps and networks
On a map, the step label is drawn inside the map, above the land and below the regions with data and the marks. If the reader zooms or pans, the view is kept from one step to the next, so a map can be played while zoomed into one continent. See Displaying geospatial data.
A network with fixed scales is laid out once, with the nodes of every step, and each step shows its own nodes where they belong: a node that is not in a step is not drawn, and neither are its links. The picture stays put and the network grows and shrinks inside it. With Change at each step, every step is laid out anew. The Animation variable has to come from the nodes table; a network cannot yet be animated by a column of the links. See Graph visualization.
Exporting, sharing and reopening
- Exporting an animated chart as SVG or PNG writes the step on screen: the background step label is part of the image, the controls are not, and the band they occupy is removed. To show several steps in a document, export each one — or use Small Multiples, which puts them side by side. Output data (CSV) also holds the step on screen.
- Publishing the chart online keeps it alive: readers get the same controls and can play it, scrub it and pause it, and Play automatically applies. See Publishing online.
- Reopening a project starts the chart at the step chosen in Start at; the step you were on is not saved. Moving to another tab pauses playback, and editing the chart stops it.
Fixed scales are measured over every step when the chart is first drawn. On a large dataset with many steps that takes a moment, once; after that, each step costs no more than a filter.
When to animate
Animation is a presentation technique more than an analytic one. Studies of animated trend charts have found that readers enjoy them more and understand them less well than the same data shown as small multiples or as traces: a reader watching one step forgets the previous ones, and attention goes to whatever moves most, which is not always what matters most.
- Use it to show a change you already understand — in a talk, on a web page, in a story where the reader is guided through it — and pick out the marks that carry the story with a color, a pinned label or an annotation.
- Use fixed scales for reading values, changing scales for reading ranks. When in doubt, fixed.
- Give the reader time. A pause on each step, or fewer steps — years rather than months — turns a blur into something that can be read.
- Keep a static answer at hand. If the reader needs to compare steps rather than watch them, a line chart over time or small multiples will do it better, and they survive export.
Robertson, G., Fernandez, R., Fisher, D., Lee, B. and Stasko, J. (2008). “Effectiveness of Animation in Trend Visualization”. IEEE Transactions on Visualization and Computer Graphics, 14(6), 1325–1332.
Where to go next
This is the last chapter. For sharing an animated chart where it can play, see Publishing online; for the static alternative, the small multiples of Structural channels.