
Part I · Fundamentals · Chapter 12
Annotations
An annotation is a note you place on the chart yourself: a sentence that points at something and says why it matters. It can point at a mark — one country, one bar, one point of a line — or at any position of the chart, including an empty one. Either way it is tied to the data, not to the screen, so it stays in place when the chart is resized, filtered or rescaled.
Annotating a mark
Right-click a mark and choose Add annotation. The editor opens with a rich-text box for the note and the settings that decide how it looks. Click OK and the note appears next to the mark, joined to it by a line.
The text can quote the mark's own data: write a variable name in square brackets, such as [Country] or [Population], and it is replaced by that mark's value.
| Setting | What it does |
|---|---|
| Annotation type | Visible writes the note on the chart. Interactive leaves a small marker that opens the note when the cursor passes over it. |
| Align, Font size, Text color, Text stroke, Text width | The note itself. The stroke is a halo in the background colour that keeps the text readable over grid lines and marks. |
| Line type, Line curvature | How the note joins what it points at: no line, a line, or one of two arrows; straight or curved either way. |
| Line color, Line width | The joining line. |
Drag the text of a visible note to move it. While you drag, its line snaps to the diagonals and the text lines up its edges or its centre with what it points at, which keeps a set of notes looking tidy. Double-click a note, or right-click it, to edit or remove it.
Annotating a position
Not everything worth pointing at is a mark. A threshold, a target, an empty corner that says something by being empty: right-click the spot, inside the area where the marks are drawn, and choose Add annotation here.
The note is anchored to the values at that spot — so many dollars of income, so many years of life expectancy — not to the pixel. It is drawn again from those values every time the chart is drawn, so it stays on the same point of the data when the window changes size or an axis changes its range.
Values are rounded to what one pixel can tell apart, so a click lands on 32,000 rather than 31,987.4. To set them exactly, the editor of a position note has a Position block with one field per variable:
- Numbers — any value inside the axis range. On a logarithmic axis, values above zero.
- Categories — a list of the categories on the axis. A note on a bar chart sits on its category's bar, wherever the click was within it.
- Dates — a date written as YYYY-MM-DD, snapped to the period the axis counts in: the year, the month or the day.
Square brackets work here too, and they write the anchored values: [Income] a year on a note anchored at 32,000 reads 32,000 a year. In small multiples, the variable of the panels writes the panel's category.
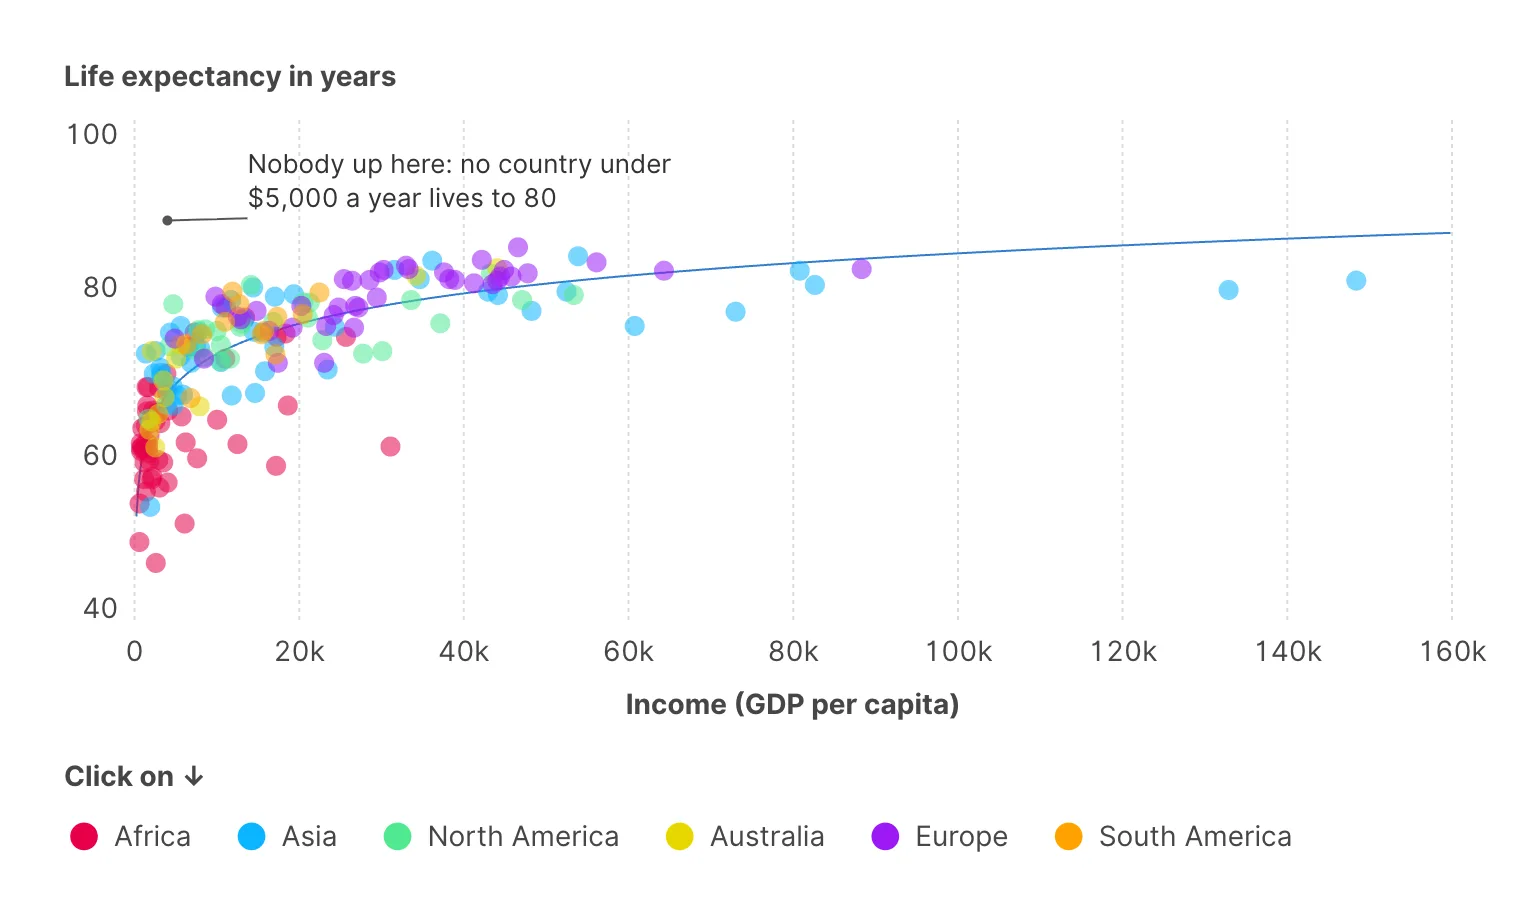
Positions can be annotated on charts with one variable on each axis — scatter plots, bar charts, line and area charts over time, strips with a single axis — and on small multiples of those, where the note belongs to the panel it was placed in. Charts with two variables on one axis, a second Y axis, parallel coordinates, networks, treemaps, pies and maps do not offer the option.
When a note is hidden
A position note names its variables, so it knows when the chart no longer shows them. Swapping X and Y is fine: the note moves with its values. But if the chart's position variables stop being exactly the ones the note was anchored to — you remove the variable on Y, add a second one, or remove the small multiples — the note is hidden. It is also hidden when its value falls outside the axis range or its category is no longer on the axis.
A mark note is hidden when no mark matches it any more, for example because a filter removed it.
Hidden is not deleted. The note is kept with the chart and comes back as soon as the chart can show it again, or when you undo the change that hid it. Renaming a column in the data table renames it in the notes too, including the square brackets in their text.
The list of annotations
Once a chart has notes, the panel of the chart has an Annotations section, after Reference lines. It lists every note: an eye that says whether it is shown, the start of its text, and what it points at — the mark's values, or the anchored variables and values of a position (hover a row to read it whole). A hidden note says why it is hidden.
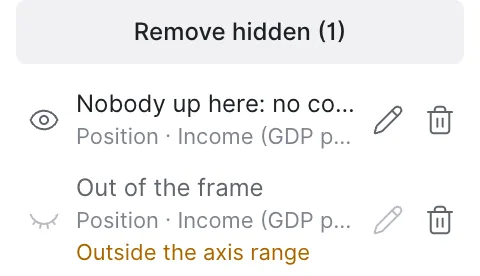
The pencil edits a note that is shown, and the bin deletes any note. Remove hidden deletes every hidden note at once, in one step that a single undo brings back.
Visible notes are part of the chart: they are in the PNG and the SVG, and in an embed. Interactive notes need a cursor, like tooltips, so in a static export only their marker remains.
Where to go next
An annotation tells the reader what to see. Adding interaction lets them look for themselves — highlighting, zoom, interactive legends and clickable marks.