
Part I · Fundamentals · Chapter 1
Introduction to SCImago Graphica
SCImago Graphica is a data visualization tool built by SCImago. You load a dataset, connect its columns to the visual properties of the marks on screen, and a chart appears. It runs entirely in your browser — there is nothing to install and your data never leaves your machine.
What it is for
Graphica is built for exploring data as much as for presenting it. Most charting tools ask you to decide what chart you want before you have seen anything. Graphica lets you change your mind cheaply: a scatter plot becomes a bar chart, a map or a treemap by moving variables between visual properties, without starting over.
That makes it a good fit for the moment when you have a dataset and a question but not yet an answer — and it stays useful afterwards, because the same chart you explored with is the one you export.
The one idea worth learning first
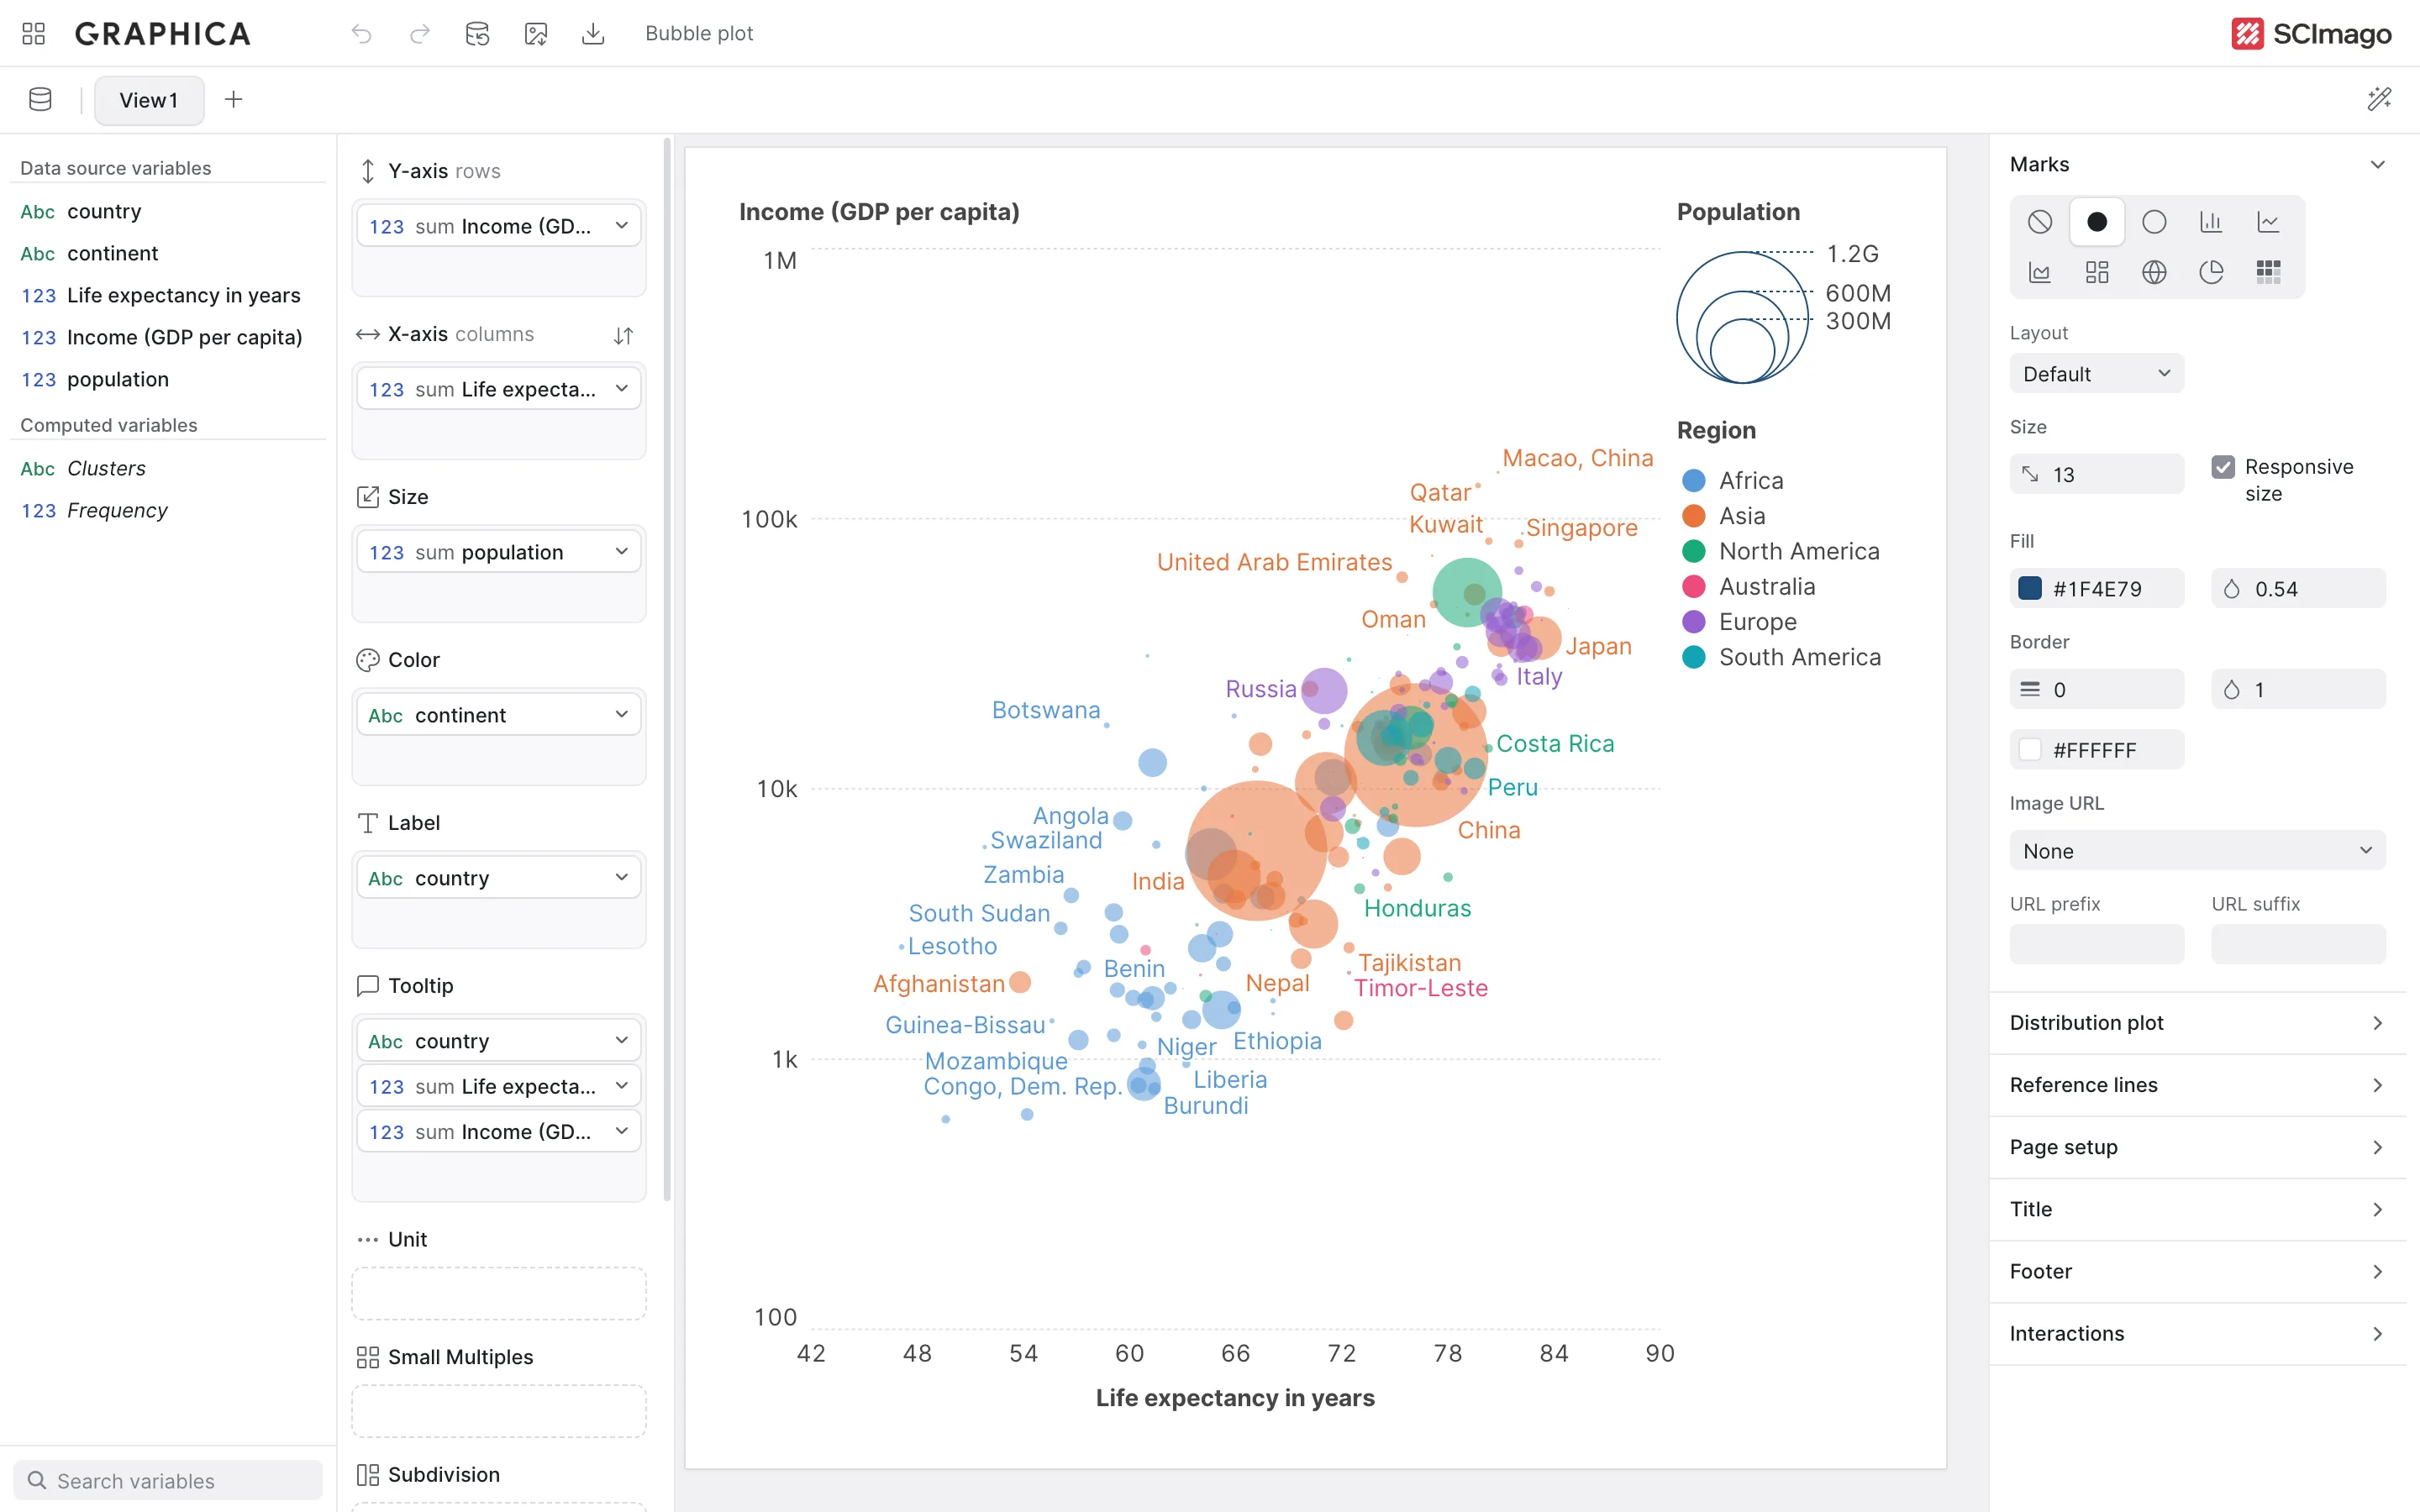
A chart in Graphica is a set of connections between variables (the columns of your data) and visual properties of the marks it draws — position, size, color, shape, text. That is called encoding, and it is what Chapter 7 is about.
There is a chart wizard, and it does present a gallery of familiar chart types — column, line, treemap, choropleth and about thirty more. But it is a shortcut, not a different mode: it picks the encoding for you and drops you into a chart you can then change freely. Understanding encoding is what turns the wizard from a set of fixed outputs into a starting point.
What you need
A dataset. Graphica reads CSV and Excel files, plus the common network formats — the full list is in Data formats and arrangement. It does not need the data cleaned to a particular shape first, though a tidy dataset will save you work.
You also need a reasonably current browser. Everything — parsing, layout, rendering, storage — happens locally, so large datasets are limited by your machine rather than by a server.
Nowhere. Files you open are read in the browser, and the projects you create are stored in the browser's own storage on your computer. Nothing is uploaded. The practical consequence is covered in Your workspace: if you clear your browsing data, you clear your projects too, so export anything you want to keep.
How this manual is organized
Part I — Fundamentals is meant to be read in order. It covers getting data in, the interface, encoding, and the four ideas that account for most of what you will do day to day: aggregation, filters, labels and interaction. It ends with exporting.
Part II — Advanced topics is reference material you can read in any order, once Part I makes sense. Each chapter takes one specialized job — maps, networks, clustering, trend lines, distributions, part-to-whole charts — and covers it end to end.
Throughout, text that appears literally in the interface is written like this, and names that appear inside project files are written like this.
The paper behind the tool
SCImago Graphica was introduced in a peer-reviewed article that sets out the reasoning this manual only describes the results of: why the tool is built on a grammar of graphics rather than a chart gallery, and how it tries to reach high expressive power and ease of use at the same time.
If you want the design rationale rather than the instructions, start there:
Hassan-Montero, Yusef; De-Moya-Anegón, Félix; Guerrero-Bote, Vicente P. (2022). “SCImago Graphica: a new tool for exploring and visually communicating data”. Profesional de la información, v. 31, n. 5, e310502.
It is also the reference to cite if you use Graphica in published work.