
Part I · Fundamentals · Chapter 3
Data types
Every column in your dataset has a type, and the type decides what the column can do. A number can drive a size; a category can drive a shape; a country can become a map. Graphica guesses the types when it reads your file, and getting those guesses right is usually the difference between a chart that works and one that refuses to.
The five types
| Type | What it holds | What it unlocks |
|---|---|---|
| String | Text — names, categories, codes. | Grouping: color, shape, small multiples, subdivision, units. |
| Number | Quantities. | Magnitude: continuous axes, size, opacity, aggregation. |
| Date / Time | Points in time, at any precision from a year to a second. | Time axes, date-aware aggregation and formatting. |
| Country | Country names or ISO codes. | Maps at country level, plus everything a String can do. |
| State / Province | First-level administrative divisions. | Maps at province level, plus everything a String can do. |
The two geographic types are Strings that Graphica also knows how to place on a map. Nothing you can do with a String stops working when a column is typed as a country — you simply gain the map.
How types are guessed
When a file is read, each column is sampled — up to forty non-empty values — and tested against each type. A type is only assigned if 90% of the sampled values match. That threshold is deliberately strict, because a wrong type is more annoying than a missing one.
The column name relaxes it. If the name already suggests the type — words like country, province, state, region, date, year — the threshold drops to 60%, on the reasoning that a column called Country with a few unrecognized entries is still a country column.
Two consequences are worth knowing, because they surprise people:
- A plain number is never guessed to be a year unless the column name says so. A column of values like 2019, 2020, 2021 called Reference stays a Number. Called Year, it becomes a Date. This is on purpose — populations, prices and IDs are four-digit numbers too.
- Countries win ties against provinces. Names that are both, such as Georgia, are read as countries. If you meant the province, set the type by hand.
Changing a type
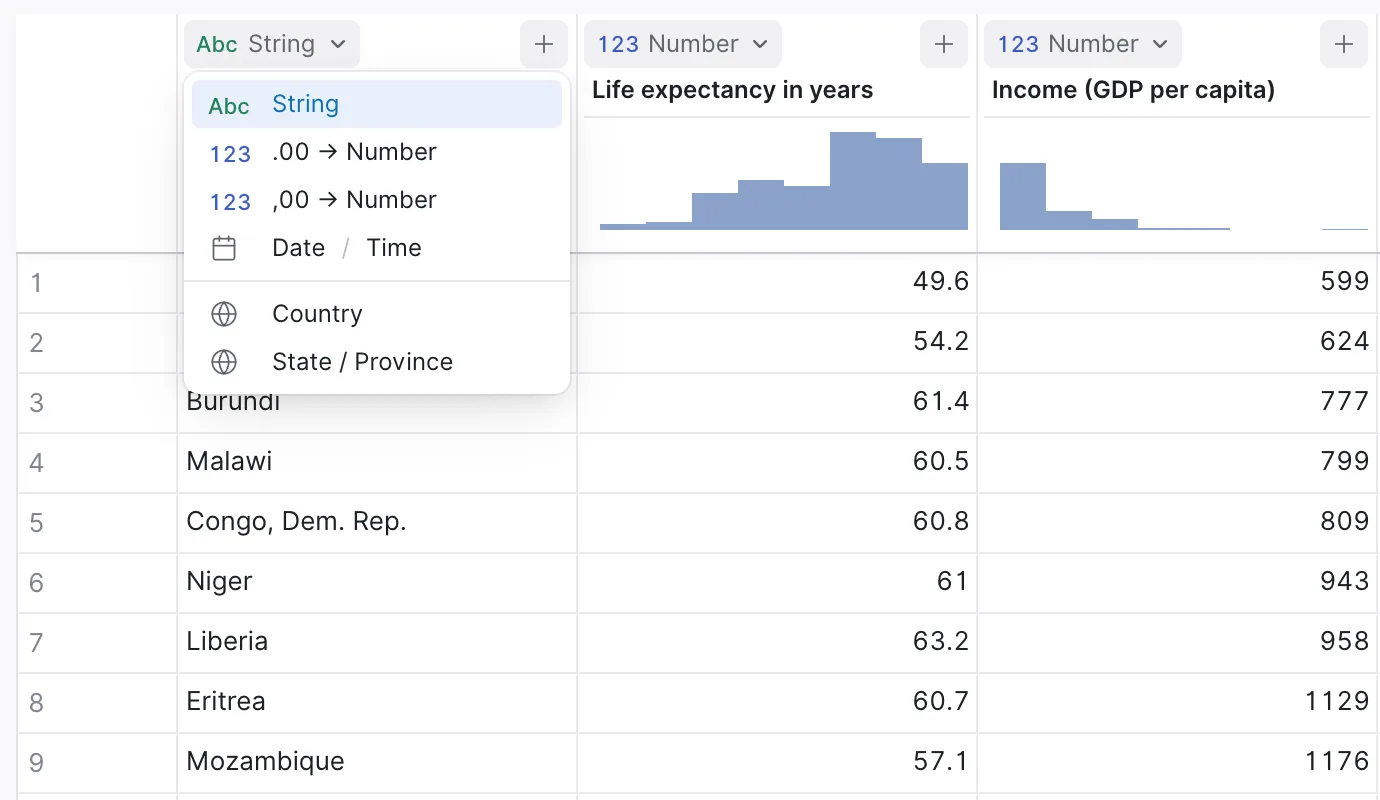
Each column header in the data tab carries a type button showing its current type. Click it and pick another.
Converting text to a number offers two entries rather than one, because the decimal separator is ambiguous: .00 → Number reads a dot as the decimal point, ,00 → Number reads a comma. Pick the one that matches your file; picking the wrong one turns 1,5 into fifteen.
When geographic values are not recognized
Country and province columns are validated against a name and code list. Values that do not match are shown in red italics in the table, and the column header reports how many there are — 10 unknown — as a link that jumps to the next one so you can work through them.
Unrecognized values are not dropped from the chart; they simply have no shape to be drawn on the map. Most of the time the fix is spelling, an abbreviation, or a territory the map source does not carry as a separate region.
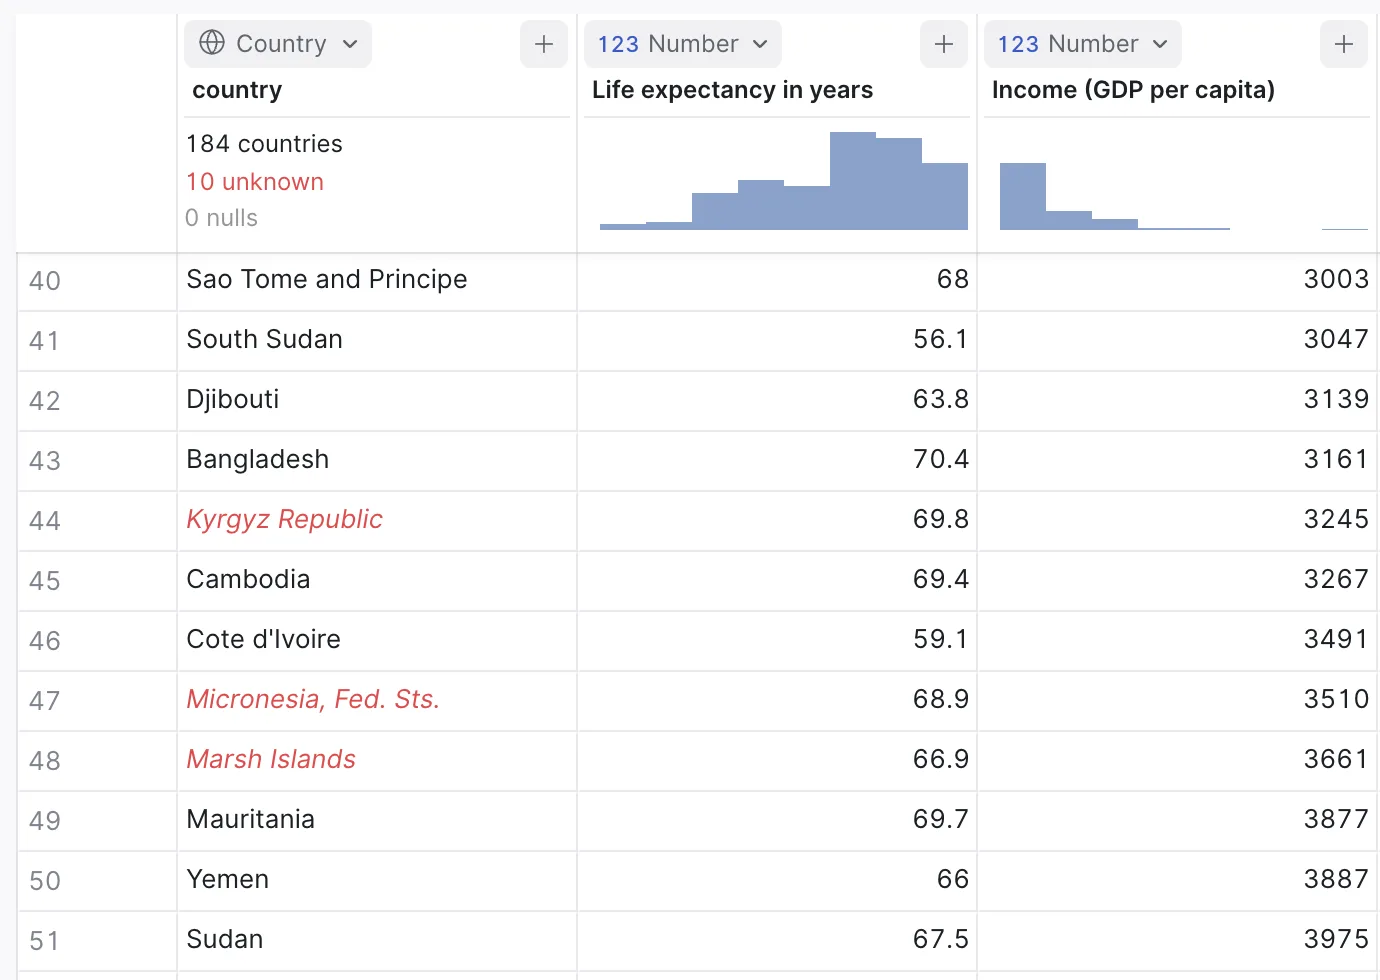
You can correct them right there in the table. Click a red cell to edit it: as you type, the field suggests the names and codes Graphica recognizes, so you can pick the right one instead of guessing how the map spells it. Apply changes that cell; Apply to All Identical Cells changes every row holding the same value, which is what you want when a country appears many times. The unknown count in the header updates as you go, and every edit can be undone.
Computed variables
You can add columns without leaving Graphica. The button beside each column header opens Compute variable:, and what it offers depends on the type of the column you started from:
| Option | Available on | What it makes |
|---|---|---|
| Calc | Number | A new column from a formula over the existing ones. |
| Percentage | Number | Each value as a share of a total. |
| Group | String, Country, State / Province | A coarser categorical column that folds several values into one group. |
| Date part | Date / Time | A component of the date — as a Number, a String or a truncated Date. |
| Clone | Any | A copy you can retype or edit without touching the original. |
Computed columns are kept apart from the ones that came in with your file. They appear under Computed variables in the variable list, and their menu offers Edit and Remove rather than the compute options — the definition stays live, so editing it recomputes the column.
A column can only have one type, but you often want two. Cloning a Year column and typing the copy as a String gives you a time axis and a set of categories from the same data — one to plot against, one to color or facet by.
Where to go next
Types are in place, so the data is ready. The user interface is a tour of where everything lives before you start building.