
Animated chart
An animated chart shows how data changes over time by playing it step by step (one year, one month, one stage at a time), with the marks moving from each step to the next. Change becomes motion: a ranking that reshuffles, bubbles that drift across a scatter plot, a map that fills in.
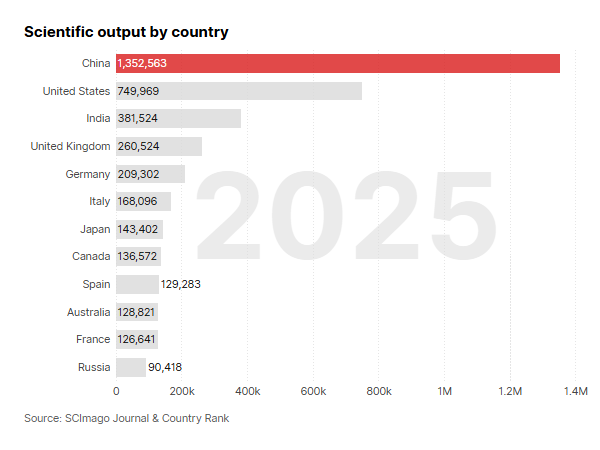
In SCImago Graphica any chart can be animated, from bars and scatter plots to maps and networks. The example is a bar chart race: countries overtake one another year by year as their scientific output grows.
How to
To animate a chart, link a date or categorical variable to 'Animation'. Each of its values becomes a step, and the chart gains a play button and a slider to move through the steps.
The rest of the chart is built as usual, and it is drawn once per step. The example is a bar chart with Country on the Y-axis, sorted by Documents, and Year linked to 'Animation'.
Click the variable in 'Animation' to open its settings:
- 'Scales': 'Fixed' keeps the same axes in every step, so the values can be compared from one step to another; 'Change at each step' fits the axes to each step, so the bars re-sort as they overtake each other, as in this bar chart race.
- 'Transition' and 'Pause': how long the marks take to move from one step to the next, and how long each step holds still.
- 'Start at' the first or the last step, 'Play automatically' and 'Loop'.
- 'Step label': where the current step is written; by default, large in the background of the chart.
More in Animating a chart, in the manual.