
Bar chart
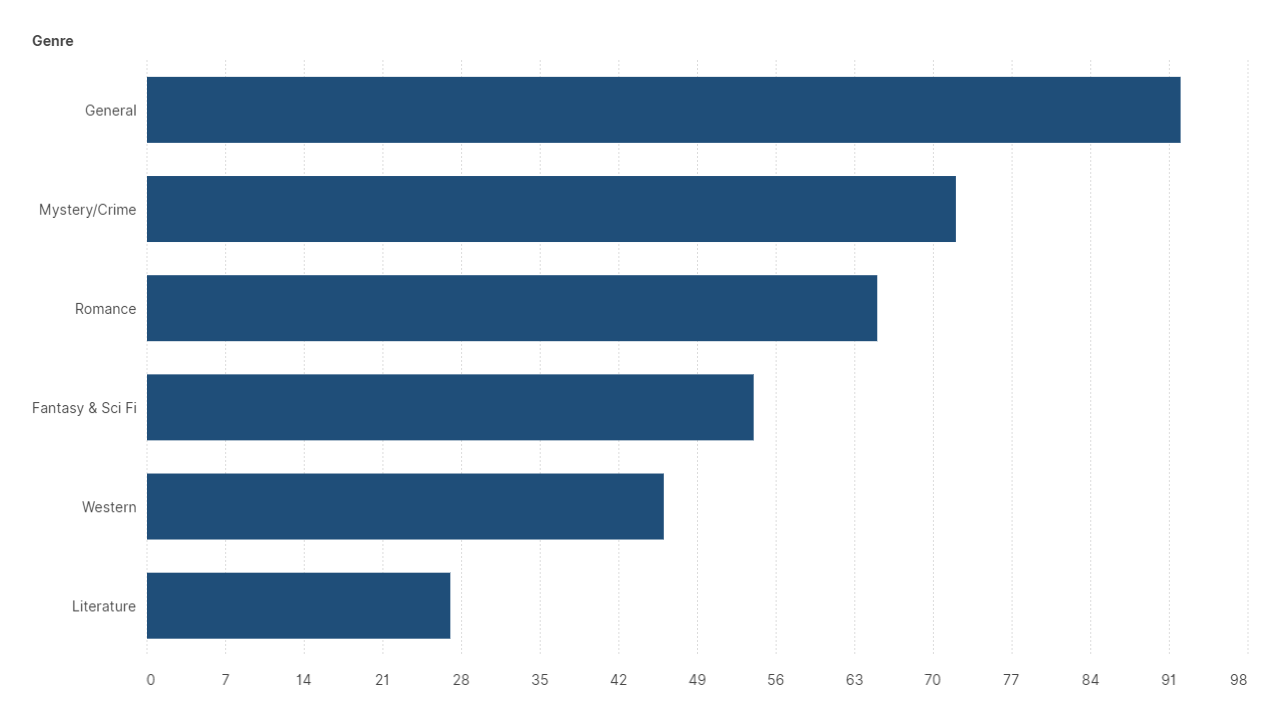
The bar chart displays the relationship between a quantitative and a categorical variable.
How to
To create a bar chart in SCImago Graphica just link the categorical variable to one of the axes and the quantitative variable to the other, selecting ‘bar’ as mark type.