
Treemap
A treemap is a visualization in which the available visual space (usually rectangular) is subdivided into regions whose area represents a quantitative value. By subdividing each region, hierarchical relationships can be represented.
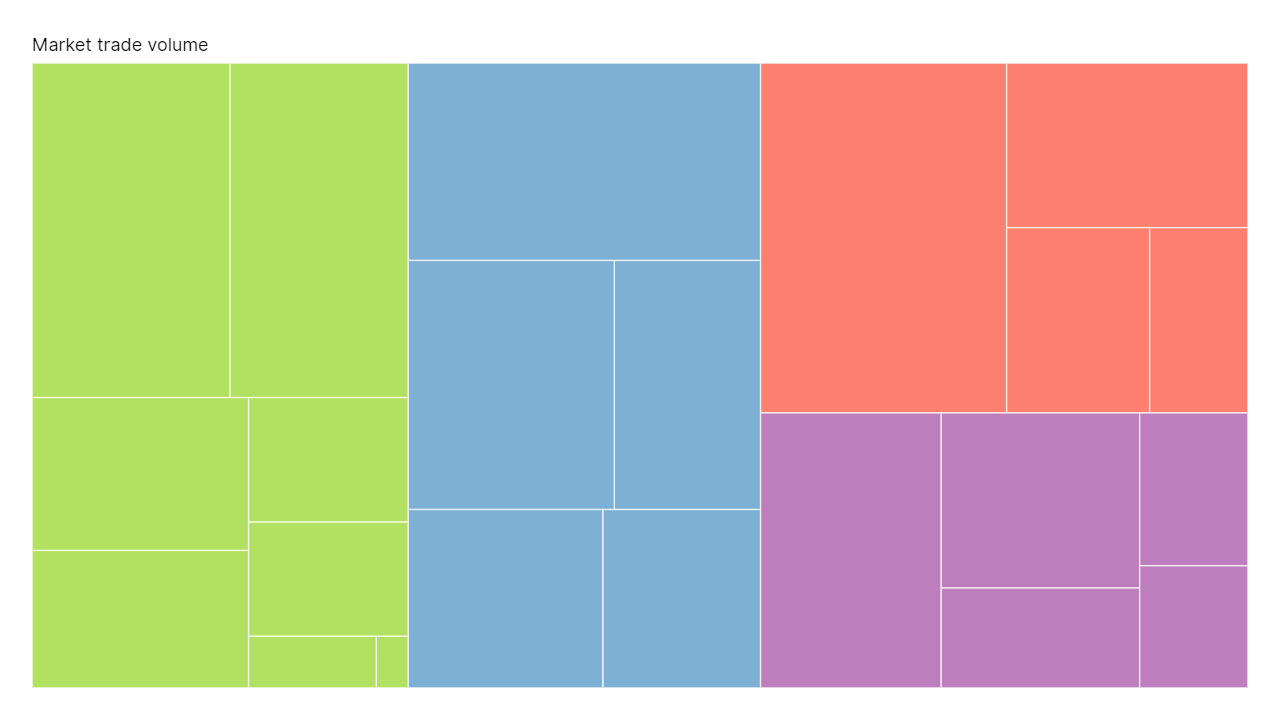
How to
To create a treemap:
- Select 'filled area' under mark type.
- Link a quantitative variable to 'size': it sets the area of each rectangle.
- Link the categorical variable whose values are the rectangles (Country in the example) to 'subdivision'.
Hierarchical levels
Each additional categorical variable adds an outer level that groups the rectangles. There are two ways to add one:
- Link it to 'color'. In the example, Region in 'color' and Country in 'subdivision' group the countries by region, each region in its own color.
- Link it to 'subdivision' too, before the variable of the rectangles. Every variable in 'subdivision' except the last one forms a level, from the outermost to the innermost: Region, Country and City nest cities inside countries inside regions.
Both ways can be combined; the variable in 'color' is always the outermost level.
Labels
Link to 'label' the variables you want to show in each rectangle (in the example, the country, its trade volume and its change).
To name the groups, link their variable to 'label' as well. It is then shown once, as a header at the top of each group, instead of in every rectangle. Click that variable in 'label' to open its options, which include a 'Group header' section:
- Uncheck 'Show as group header' to print the variable in every rectangle again.
- Edit the 'Header text'. It can include other columns, aggregated over the whole group:
[Region] ([Market trade volume])shows each region with its total volume. - Set its font, size, color and opacity apart from the rest of the labels. 'Coloured as the marks' paints each header in the color of its group, as in the example, and 'Ensure contrast' darkens or lightens that color until it stands out from the background.
A header is left out when it does not fit in its group, or when every group holds a single rectangle. Right-clicking a header opens its settings directly.