Scatter plot
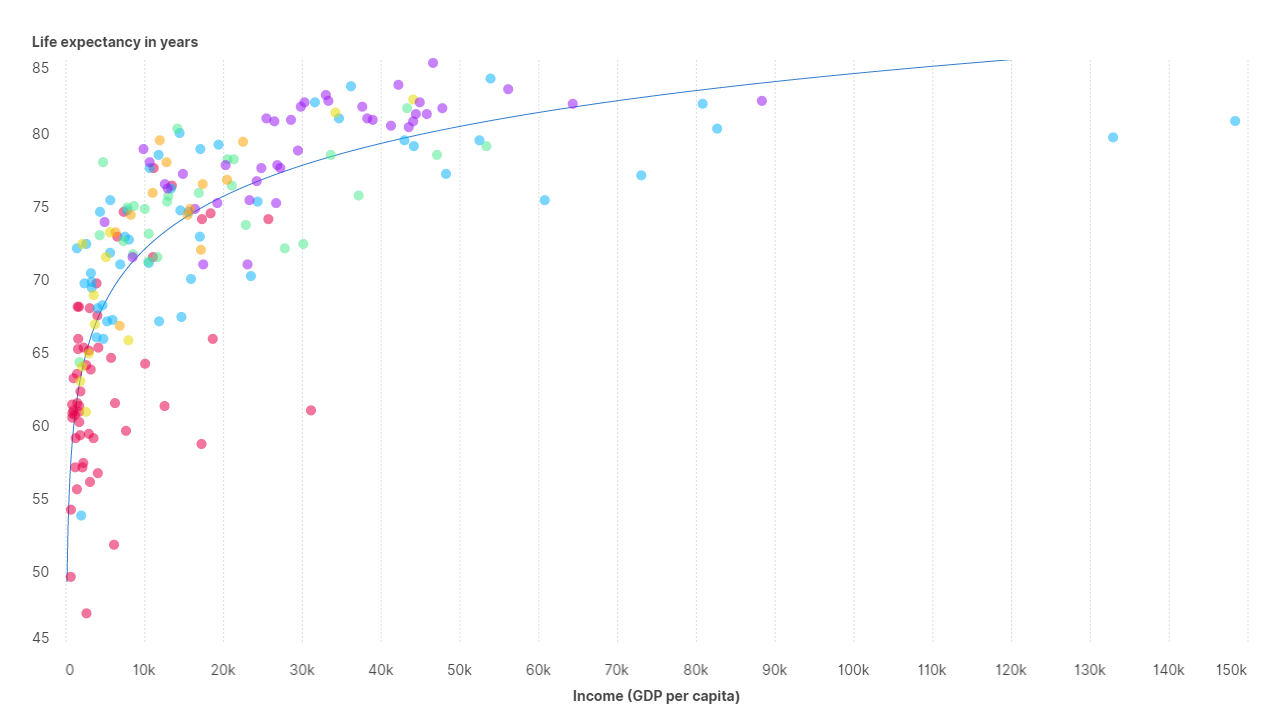
A scatter plot shows the relationship between two quantitative variables.
How to
To create a scatter plot, simply link one of the variables to the X-axis and the other to the Y-axis.

A scatter plot shows the relationship between two quantitative variables.
To create a scatter plot, simply link one of the variables to the X-axis and the other to the Y-axis.