
Histogram
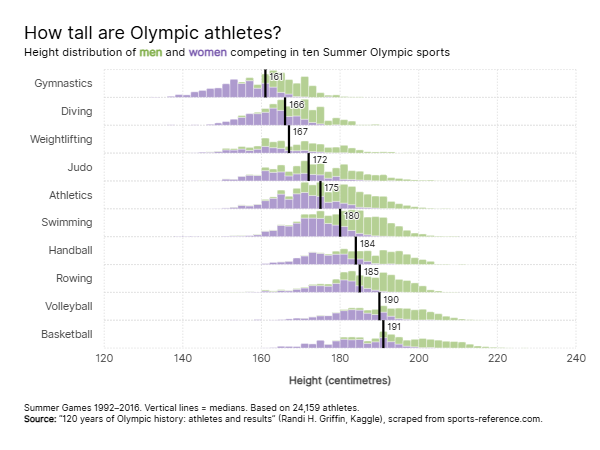
A histogram visualizes the distribution of a quantitative variable by representing the frequency of its values or groups of values by means of bars.
How to
In SCImago Graphica, making a histogram is as simple as selecting ‘bar’ in mark type, linking the quantitative variable to one of the axes, and linking the ‘graphica.com.frequency’ variable to the other axis.