
Dumbbell chart
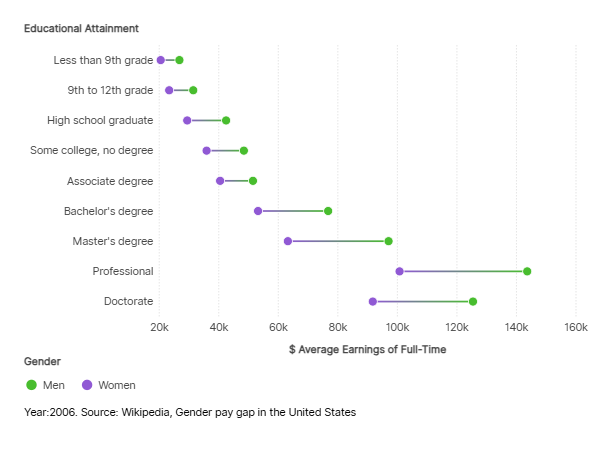
Dumbbell charts emphasize the difference between quantitative values by connecting these values with lines.
How to
There are two ways to create a dumbbell chart in SCImago Graphica:
1. Link a quantitative variable to one of the axes, and a categorical variable to the other axis. Then select 'line' as the mark type, and select which variable specifies the order of the connection (Connection variable).
or instead:
2. Link a quantitative variable to one of the axes, and a categorical variable to the other axis. Select 'circle' as the mark type, and under 'Distribution plot' choose 'Box plot'.