
Connection map
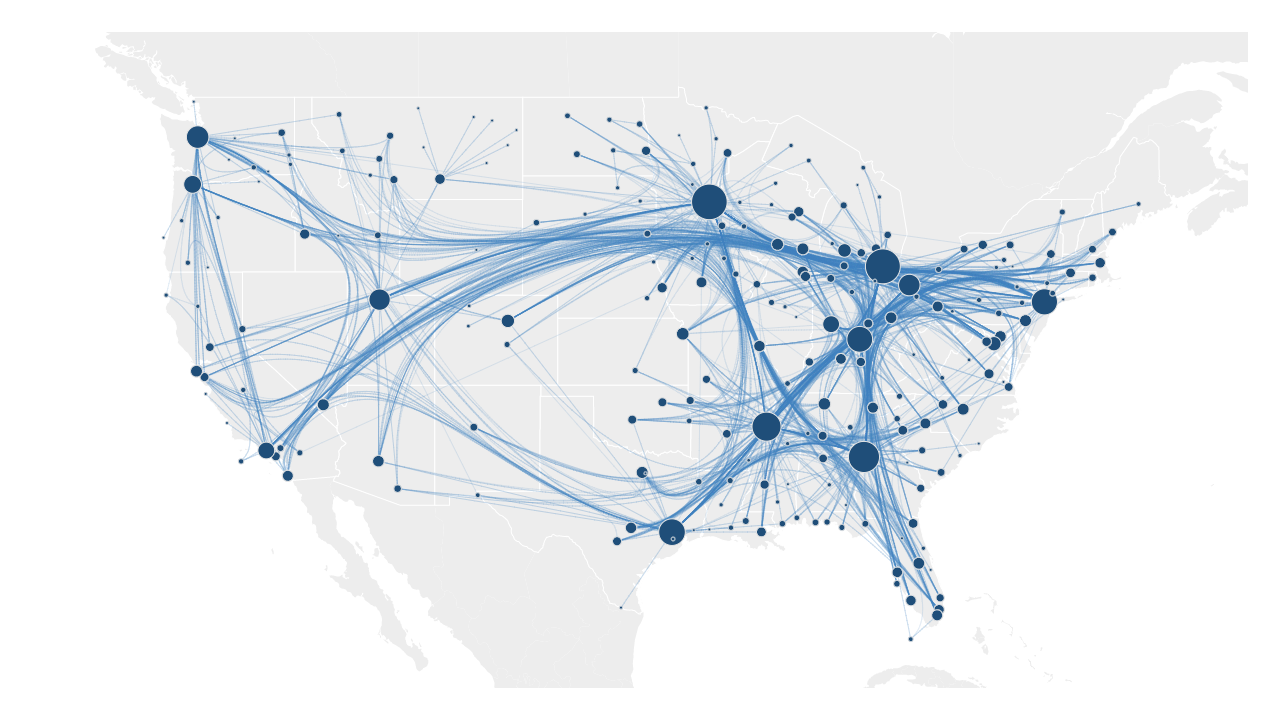
A connection map is a graph or node-link diagram, in which the position of the nodes is geospatial. Links between nodes can be undirected or directed (flow map).
How to
To create a connection map it is necessary that the dataset includes information about the network relationships.
SCImago Graphica can work with standard graph formats such as GML or GraphML, but also with its specific format (see sample data) or even with simple lists of links.
There are two ways to create a map in SCImago Graphica:
1. Link a geographic variable (Country) to 'unit' and in ‘Marks → Layout’ select 'map'.
or instead:
2. Link a quantitative variable (latitude) to the Y-axis, link a quantitative variable (longitude) to the X-axis, and in ‘Marks → Layout’ select 'map'.
From the "Links" menu you can modify the appearance of the links between nodes.
This example uses the link-bundling technique, which aims to reduce visual clutter by clustering links with similar paths.