
Cartogram
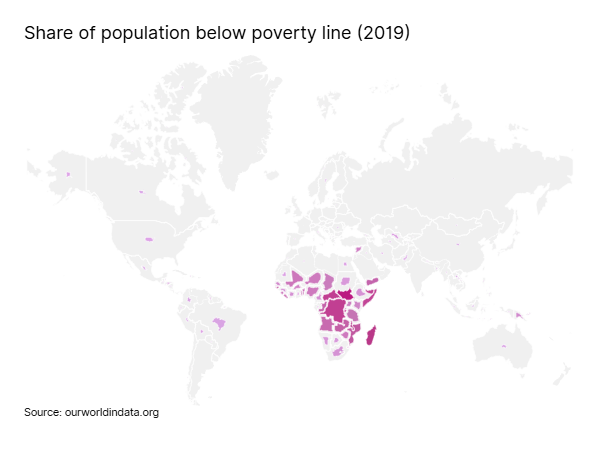
A cartogram is a map in which the size and shape of the different regions are distorted to depict the values of a quantitative variable.
How to
To create a cartogram:
- Link a geographic variable (Country) to 'unit' and in Marks select 'filled map'.
- Link a quantitative variable to ‘Size’.