Home → Learning → User Guide
Data types
When you load the data, if it is organized correctly, you will see a table with different columns for the different variables (also known as dimensions or attributes). The header of each of these columns includes:
- The variable name (it is an editable field).
- A small chart summarizing the value distribution of the variable.
- A drop-down menu with which you can select the type of variable.
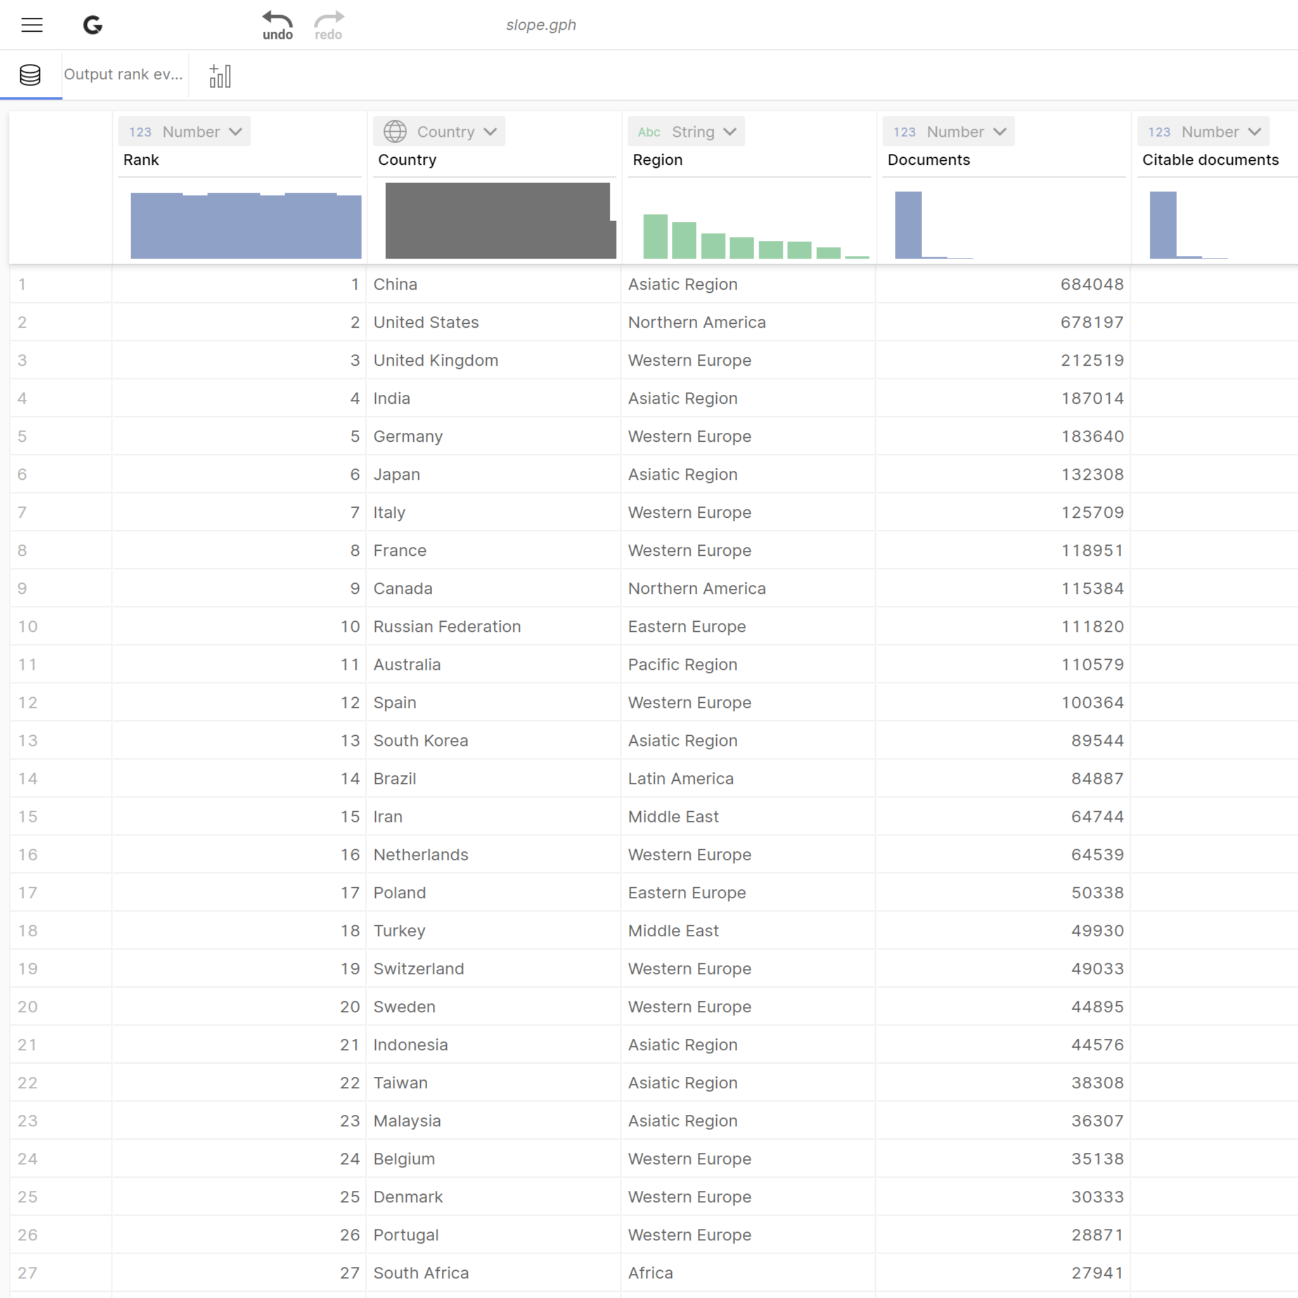
Graphica will try to automatically detect the type of each variable, but in some cases you will have to define it yourself.
The data types supported by Graphica are:
- String
- Number: Graphica expects that the decimal separator used is the dot
- Date / Time
- Country: When the values are country names or their ISO code, selecting this data type will allow you to visualize them using geographic maps.
When the loaded data is in graph format, in the lower left corner you will find two tabs to switch between vertices and edges.

